What Is a Good Heart Rate Variability? Normal Ranges by Age
Everyone wants a number to compare themselves against. HRV is the metric where that instinct does the most damage — here’s what a good HRV actually means, and why your own baseline is the only benchmark worth having.

HRV is the metric people most want a scoreboard for, and the one where a scoreboard does the most damage. Almost every search for "what is a good HRV" is really asking "am I normal?" — and the honest answer is that the number alone can’t tell you.
Here is what it actually measures, what the age ranges are worth, and how to read yours without drawing the wrong conclusion.
The short answer
A good HRV is one that is stable or gently rising, measured against your own baseline. That is not a dodge — it is the finding that matters most. Healthy people of the same age and fitness routinely differ by 50 ms or more. A 45 ms average could be excellent for one person and a warning sign for another.
If you want population context anyway, the table below gives it. Read the section after it before you use it for anything.
What does heart rate variability mean?
Your heart does not beat like a metronome. At 60 beats per minute, the gaps between beats are not all exactly one second — they vary by milliseconds, beat to beat. Heart rate variability is that variation, and counter-intuitively, more of it is generally better.
The variation comes from your autonomic nervous system, which runs on two opposing branches:
- Sympathetic — the accelerator. Stress, exertion, caffeine, illness. It steadies and speeds up the beat, lowering variability.
- Parasympathetic — the brake, carried largely by the vagus nerve. Rest, digestion, recovery. It introduces variation between beats, raising HRV.
So HRV is best understood as a rough readout of which branch is currently winning. High HRV suggests your body is in a recovered, adaptable state. Low HRV suggests it is working on something — a hard session, a bad night, a virus, a stressful week.
Most wearables report a metric called RMSSD (the root mean square of successive differences between beats), usually averaged across your night. If your device shows HRV in milliseconds, this is almost certainly what you are looking at.
HRV chart by age
Heart rate variability declines with age in nearly everyone. These are approximate overnight ranges — the normal range for healthy adults, by age band:
| Age | Typical overnight range | Broad interpretation |
|---|---|---|
| 20–29 | 55–105 ms | Highest values of adult life for most people. |
| 30–39 | 45–95 ms | Beginning of the gradual decline. |
| 40–49 | 35–85 ms | Individual variation now outweighs age. |
| 50–59 | 30–70 ms | Fitness and sleep matter more than the number. |
| 60–69 | 25–60 ms | Lower is expected and normal. |
| 70+ | 20–50 ms | Trend over time is all that’s meaningful. |
Approximate population ranges for orientation only. Published figures differ considerably between studies, and devices differ systematically in what they report — your watch’s numbers may not be comparable to this table at all.
Why that table is the least useful part of this page
It is the part everyone screenshots, and it deserves three warnings.
- 1Individual variation dwarfs the age effect. Two healthy 35-year-olds can sit at 30 ms and 110 ms, both entirely normal. The spread within an age band is far wider than the difference between bands.
- 2Measurement conditions change the number more than your health does. Overnight averages, morning spot-checks and mid-day readings produce different values from the same person on the same day. Breathing rate alone moves HRV substantially.
- 3Devices are not comparable. Different sampling rates, different algorithms, different averaging windows. Switching brands can shift your HRV by tens of milliseconds without anything changing in your body.
If you take one thing from this article: a chart tells you what is common. It cannot tell you what is good for you.
What your watch is actually measuring
This is the part most HRV guides leave out, and it is worth understanding before you take any reading too seriously.
True HRV is derived from an ECG, which records the heart’s electrical activity directly. The gaps between the sharp R-peaks of consecutive beats are the R-R intervals, and HRV is calculated from those.
A wrist wearable has no ECG. It uses an optical sensor that shines light into your skin and detects the pulse of blood arriving at your wrist. The gaps it measures are between pulse arrivals, not electrical beats — a metric properly called pulse rate variability.
None of this makes wrist HRV useless. It makes it a trend instrument rather than a measurement. Which is exactly how it should be read — and the same conclusion we reached about sleep scores.
What affects heart rate variability
Roughly in order of how reliably each one shows up:
| Factor | Effect | Notes |
|---|---|---|
| Alcohol | Sharp drop | The most consistent single influence. Visible even after one or two drinks, often for a full night. |
| Poor or short sleep | Drop | Both duration and fragmentation matter. |
| Illness | Drop | Often falls a day or two before you feel symptoms. |
| Hard training | Drop, then rebound | A dip after a hard session is the system working, not failing. |
| Psychological stress | Drop | Work pressure and poor sleep compound each other. |
| Dehydration and heat | Drop | A warm bedroom alone can lower your overnight figure. |
| Late heavy meals | Drop | Digestion keeps the sympathetic branch engaged. |
| Consistent aerobic exercise | Gradual rise | The most reliable way to raise your baseline — over months, not days. Easy Zone 2 effort does more here than hard sessions. |
Notice that most of these are acute. One low reading tells you about yesterday, not about you.
How to read yours properly
- 1Establish a baseline first. Two to four weeks of consistent overnight readings before you draw any conclusion at all.
- 2Watch the rolling average, not the daily number. A 7-day average against your own 60-day average is the comparison that carries information.
- 3Keep conditions constant — same device, same wrist, same strap tightness, measured overnight while asleep.
- 4Expect noise. Day-to-day swings of 20–30% are ordinary in healthy people.
- 5Look for sustained divergence. A week or more meaningfully below your own baseline is the signal worth acting on — usually by resting.
How to raise it
The levers that work are slow ones: more sleep at more consistent times, less alcohol, a bigger aerobic base, and slow breathing practice. Expect months rather than days — and note that chasing a number you saw in a chart is not one of them.
We go through each of these, how long they take to show up, and what to do about a reading that has dropped, in why is my HRV so low.
When a low HRV is worth attention
A single low night is meaningless. Two patterns are worth taking seriously:
- A sustained decline over several weeks without an obvious explanation, especially alongside fatigue, poor sleep, or a rising resting heart rate.
- A sharp drop that does not recover after a few days of genuine rest.
How we handle it
Your overnight heart data is about as personal as data gets — it moves with your illnesses, your drinking, your stress and your sleep. So when it syncs to the cloud, it is saved under a random ID kept separate from your name and email — on its own it can’t be tied back to you — and locked to your account, so an anonymous request for it is refused. We never sell it, there are no advertising or analytics trackers in the app, and you can see where it actually lives.
We also try not to turn it into a game. No daily grade out of 100, no streak to protect — just your trend and plain language about what changed. Every tracking feature works with no subscription, and one tap erases the lot.
What we will not claim: that our HRV figures are more accurate than anyone else’s. Every wrist device on the market is inferring variability from a light sensor, ours included. The difference is what happens to the number afterwards.
HRV is the metric the subscription wearables are built around. How each brand handles the data behind it is the more useful comparison.
So — what is a good HRV? The one you had last month, holding steady or drifting up. Everything else is context.
Frequently asked questions
- What is a good HRV?
- There is no universal good HRV. Healthy adults of the same age can differ by a factor of three, so the useful definition is a value that is stable or gently rising against your own baseline. Population ranges run roughly 55–105 ms overnight in your twenties down to 20–50 ms past seventy, but individual variation is wider than the age effect.
- What is a normal HRV by age?
- Approximate overnight ranges for healthy adults: 55–105 ms in your twenties, 45–95 ms in your thirties, 35–85 ms in your forties, 30–70 ms in your fifties, 25–60 ms in your sixties, and 20–50 ms past seventy. Treat these as orientation only — published figures vary between studies and devices differ systematically in what they report.
- Why is my HRV so low?
- The most common causes are recent alcohol, short or poor sleep, illness, a hard training session, psychological stress, dehydration or a warm room. Most are acute, so one low reading reflects yesterday rather than your health. A sustained decline over several weeks without explanation is worth attention, and worth discussing with a doctor if it comes with fatigue or a rising resting heart rate.
- Is HRV from a smartwatch accurate?
- Partly. True HRV comes from an ECG measuring electrical activity between heartbeats. A wrist wearable uses an optical sensor and measures pulse rate variability — the timing of blood arriving at your wrist. It tracks true HRV closely at rest, which is why overnight readings are the most trustworthy, but it is affected by blood pressure, skin temperature and strap tightness. Read it as a trend instrument, not a measurement.
- How can I improve my HRV?
- Sleep more and at consistent times, drink less alcohol, build an aerobic base with regular easy-effort cardio, and practise slow breathing. These work over months rather than days. See our guide to a low HRV for the full detail on each lever and how long it takes to show up.
- What is normal heart rate variability?
- There is no single normal value. Approximate overnight ranges for healthy adults run 55–105 ms in your twenties, 45–95 ms in your thirties, 35–85 ms in your forties, 30–70 ms in your fifties, 25–60 ms in your sixties and 20–50 ms past seventy. The spread within any age band is wider than the difference between bands, so your own baseline is the only benchmark that means much.
- What is the average heart rate variability by age?
- Averages fall steadily with age, from roughly the 70s in milliseconds in early adulthood to the 30s past seventy. Published figures vary considerably between studies and measurement methods, and devices differ systematically in what they report — treat any chart as orientation rather than a target.
- Why do two devices show different HRV?
- Because they sample at different rates, use different algorithms, and average over different windows. Switching brands can shift your reported HRV by tens of milliseconds with no change in your body. Only compare your readings against your own history on the same device.
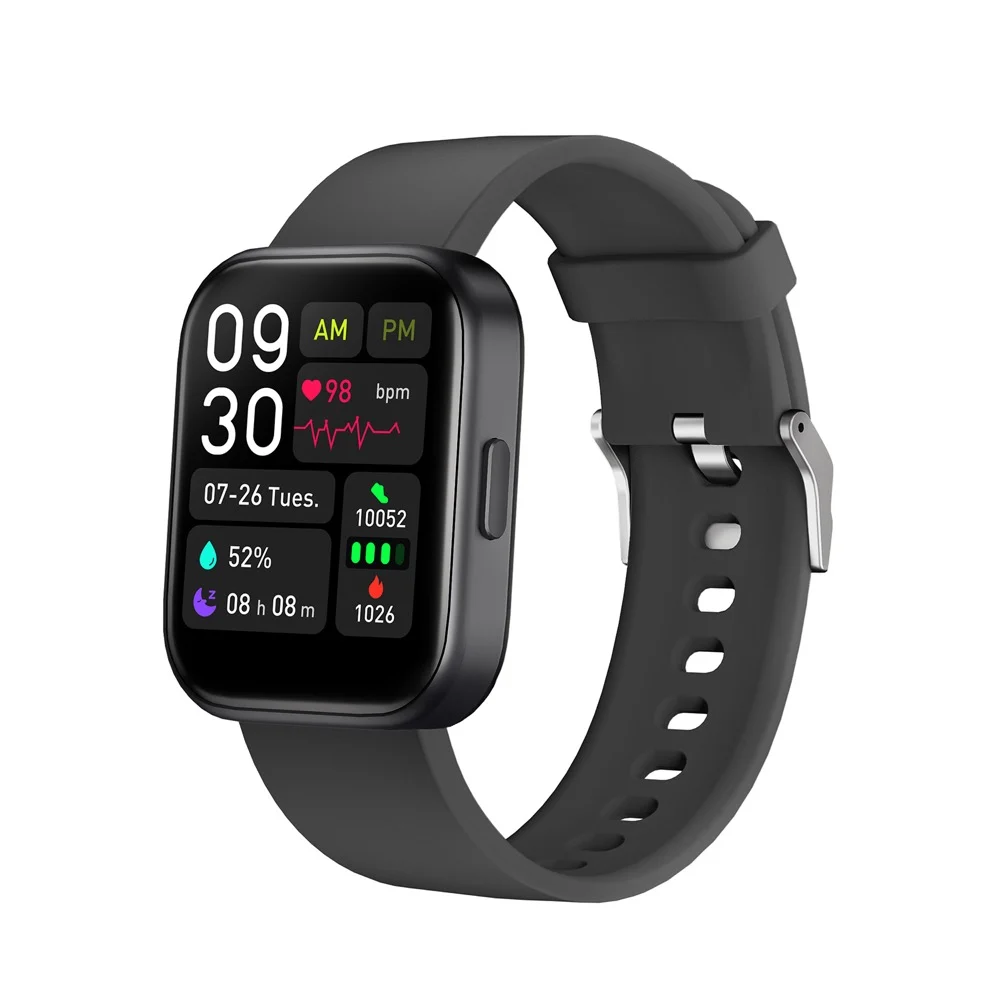
Your HRV, never sold and yours to delete
The Tribe Watch tracks your overnight heart rate and variability, shows you your trend in plain language, and never sells it — no advertising or analytics trackers in the app, and stored under a random ID rather than your name. $119.99 once, where the membership bands charge $199–$359 a year.
- Never sold, and no ad or analytics trackers in the app
- Locked to your account, saved under a random ID
- Erase everything with one tap, whenever you want
- No subscription for any tracking feature
Private by design. Yours by default.